The most successful business entrepreneurs understand the value of data. Metrics paint a clear picture of performance and give critical insights for progress. Analyzing important e-commerce indicators related to brand revenue, credibility, and customer base development results in greater revenue and wiser, data-driven decisions.
2021 has gone, let’s see what your Shopify store has performed last year!
1. Website Visits
This measure depicts the number of people that visit your online store in a certain time period. Website traffic is counted in "sessions," which Google defines as "a set of interactions that occur over a period of time."
Web traffic
The amount of traffic you receive is a metric for how effective your marketing plan is. A drop in website traffic following the launch of a campaign, for example, might suggest that the effort wasn't as effective as you had intended. You may use this data to find out what went wrong and better your campaign in the future. While there are various ways to bring traffic to your Shopify store, including social media, sponsored search, SEO, content marketing, and more, the most important thing is to drive the appropriate traffic.
Each month, focus on bringing high-quality traffic (your ideal consumer) to your site.
2. Rate of Bounce
The bounce rate is the percentage of visitors that come to your site and leave after reading only one page. The lower the time visitors spend on your website, the higher the bounce rate.
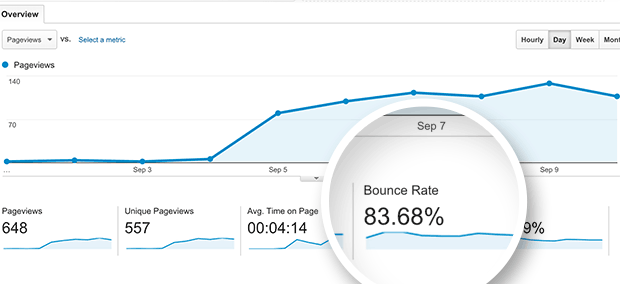
Bounce Rate
High bounce rates can be caused by a variety of factors, including bad UI/UX design, difficult or disorganized buying procedures, or a sluggish site speed.
One simple option to improve the entire customer experience is automation. In fact, 61% of organizations that implemented automation in 2020 exceeded their sales projections. Using process automation, retailers may save 10 to 50% of the time they would otherwise spend on manual operations while simultaneously increasing income. Create workflow automations to receive, handle, and track customer orders while also enhancing the entire shopping experience.
3. Session Duration on Average
The average time a visitor spends in your business in a single visit is known as the average session duration (or session). This ecommerce measure is used to determine dwell time, or the amount of time people spend on your site.

Clear and high-quality product image
Your store is appealing and simple to browse if the average session length is greater than three minutes.
The following factors may contribute to a long average session duration:
High-quality Images of products
Content that is relevant to your target audience
Product descriptions that are compelling
Beautiful theme for your store’s website
4. Returning Users vs. New Users
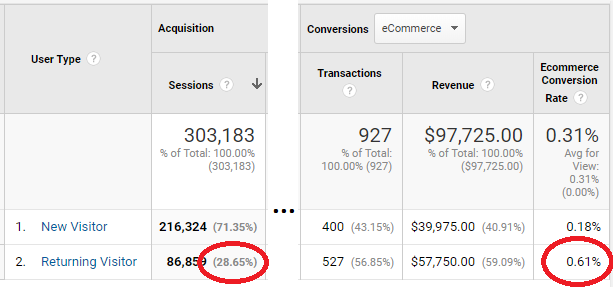
Check new visitors vs returning visitors
You may compare the amount of new website visits to the number of returning users using new vs. returning user’s statistics. It also shows the effectiveness of your marketing plan. For your ecommerce business, this measure depicts the most successful traffic routes, lead generating approaches, and marketing initiatives.
For example, if a traffic source generates a higher percentage of new users, it is more effective (and potentially profitable). Returning customers may spend more time exploring your website than new visitors. With Shopify solutions like Smile, Growave, or ReferralCandy, you can take advantage of this chance to offer new users rewards.
5. Conversion Rate on the Internet
The percentage of web visitors that completed the desired activities on your online store is your ecommerce conversion rate.
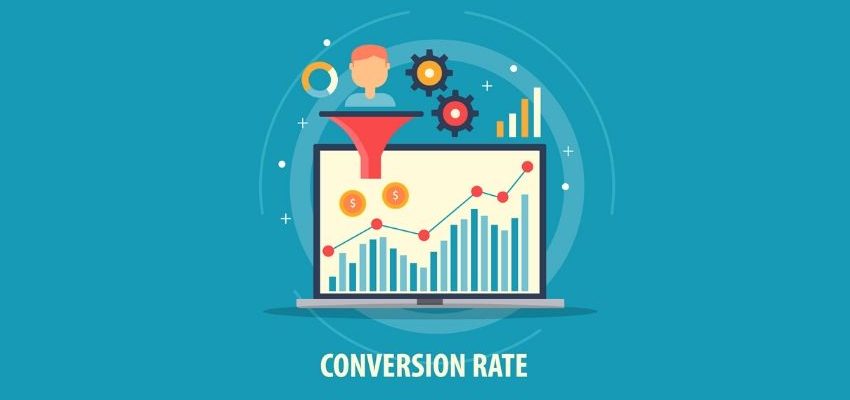
Conversion Rate
Given that the average conversion rate for e-commerce websites is 2.86 percent, you should monitor yours to see whether you're receiving the results you desire.
Purchase isn't the only way to convert. Conversions of different kinds include:
Sign up for your mailing list.
Putting anything in their shopping cart
Click on one of the advertisements.
The number of times social media content has been shared
6. Customer Acquisition Cost (CAC)
The cost of acquiring a customer is known as the customer acquisition cost.
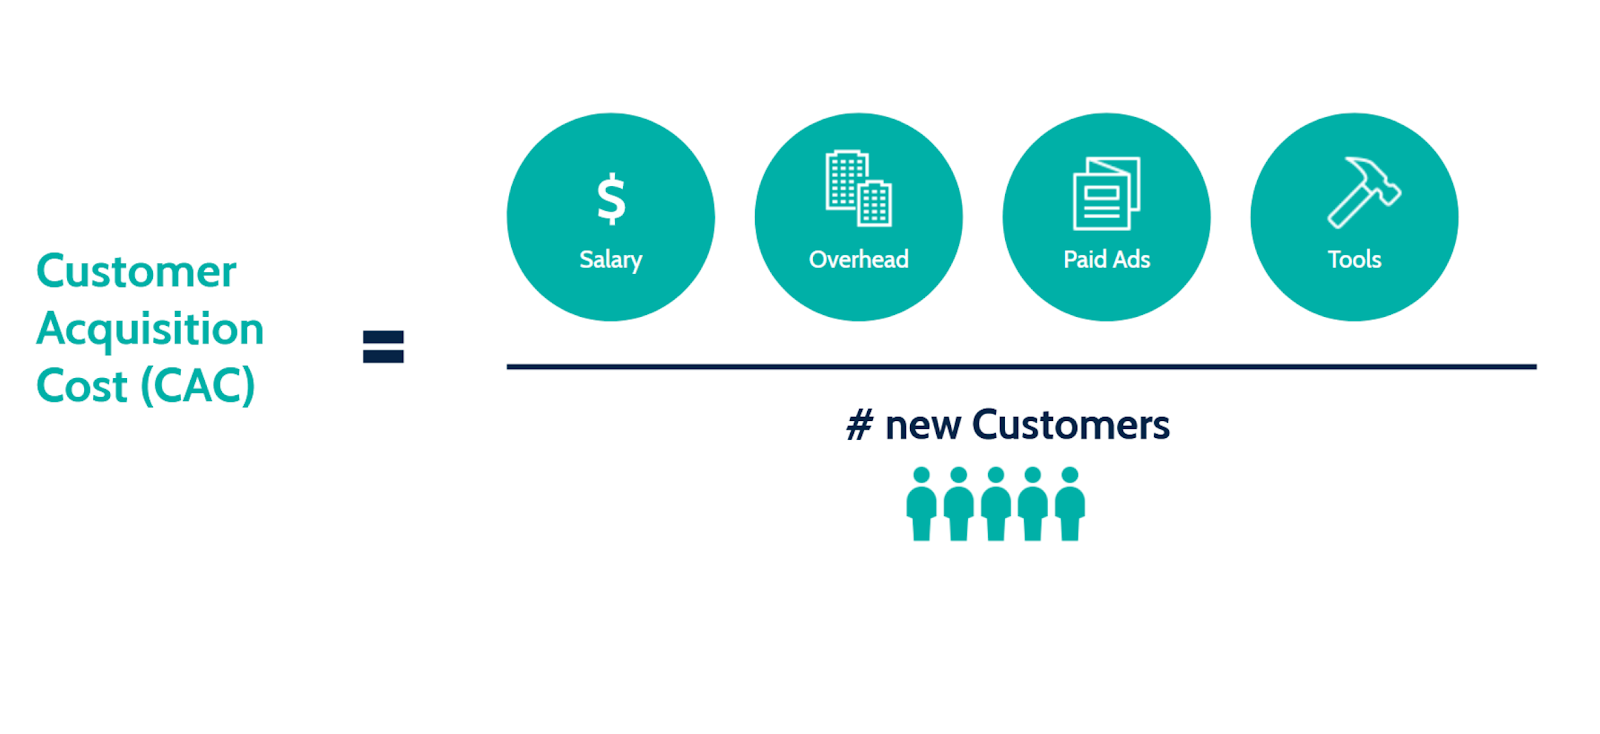
How to calculate Customer Acquisition Cost?
When you evaluate your customer acquisition cost, you get a clear picture of the resources that go into acquiring a new customer for your company. This measure aids you in determining which channels to dedicate your marketing money to.
Tracking your CAC is even more important now that Apple's recent iOS upgrade has increased the cost of attracting new consumers. These data privacy restrictions have made it hard for marketers to advertise to iOS users, as well as limiting the ability to follow consumer statistics.
7. CTR (Click-Through-Rate) on Emails
The average email open rate is 18.0 percent across industries, with a 2.6 percent average email click-through rate. While it's critical to expand your email list, you should also focus on email engagement. To put it another way, you want to send emails that your subscribers will really read.
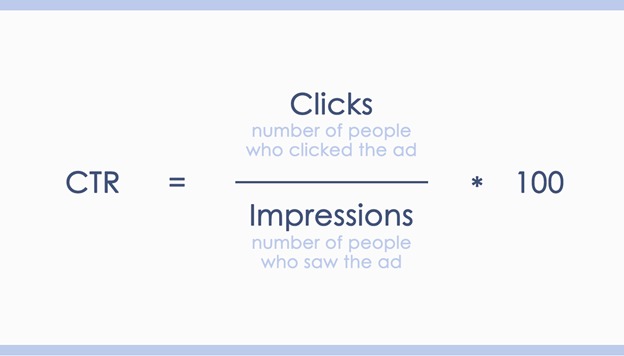
Click-through-rate
You may establish relationships with your subscribers by having them interact with your email, which can eventually lead to money. So, how do you know whether or not your subscribers are active readers? The percentage of email subscribers who open your email and click on hyperlinks inside the email content is known as the email click-through rate.
Now, you might have known the benchmark to track the performance of your Shopify store. In case you want to have a full overview over your store sales, you can consider using one of the best Shopify reporting apps such as Super Reports, it will never let you down!

