Shopify has made running an e-commerce business easier for one million sellers. However, native reporting and analytics options for businesses of a particular scale (especially Shopify Plus stores) are fairly restricted compared to what they require.
Shopify Analytics and Reports: What You Need to Know?

Shopify Reports
You bring up your analytics tool at the end of the day (or week, or month) and write down some critical numbers. "Traffic is up 2% over the previous week." Nice!” You give yourself a pat on the back and maybe perform a little chair dance.
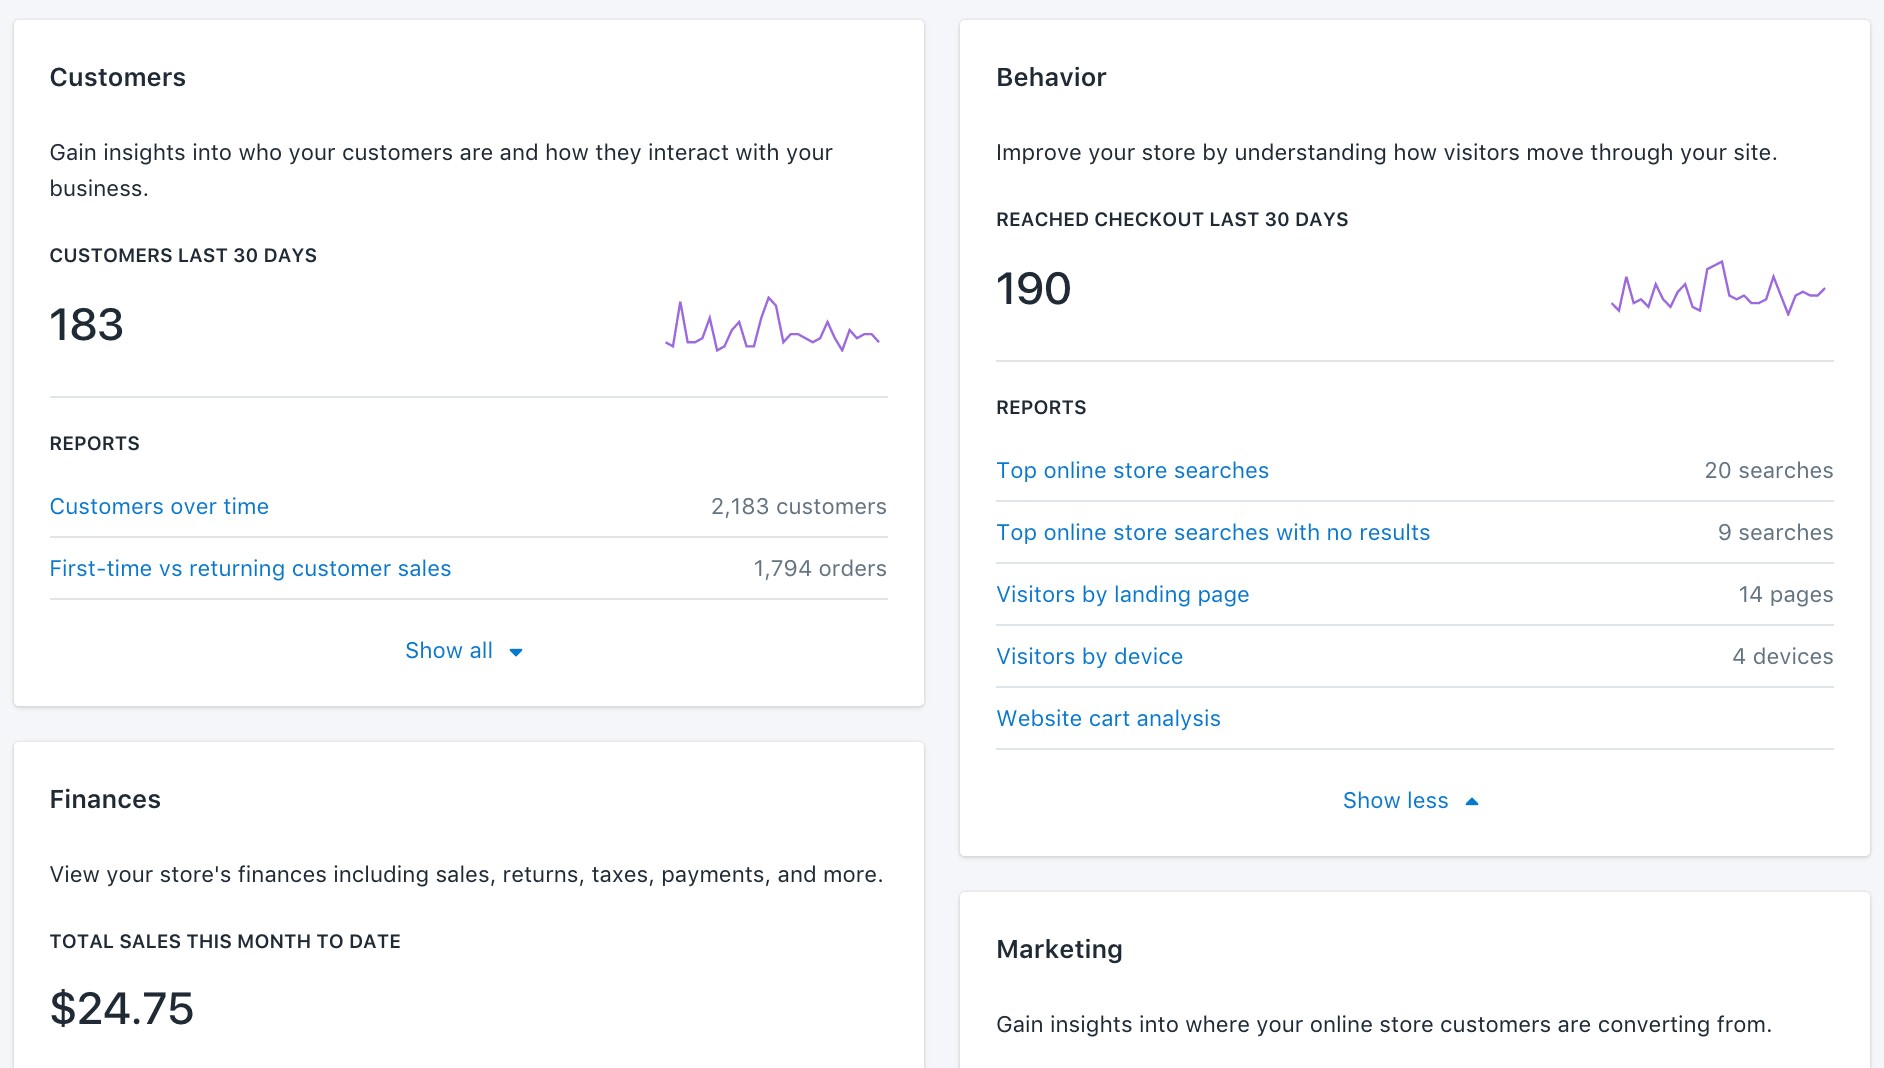
Shopify's analytics and reporting tools allow you to examine current activity in your store, have a better knowledge of who is visiting your online store, assess performance indicators (such as load times), and much more.
TYPE OF SHOPIFY REPORTS
When you open your analytics, you'll be confronted with a large amount of data. That type of volume suddenly becomes overpowering. Here's a rundown of the several sorts of Shopify reports accessible to business owners to help you concentrate your efforts:
Acquisition Report
Visitors to your website are the topic of acquisition reports, which comprise three essential metrics:
Sessions over time: This graph depicts the number of visits over time.
Sessions by referrer: The number of visits and sessions referred by a specific source, such as an affiliate link or a Facebook ad, is displayed here.
Sessions by location: This displays the nations and areas from where your online store's visitors come.
It's vital to note that the number of visits and visitors is determined by cookies, one of which identifies the device (visitor) and the other of which identifies the duration of the visit. This implies that a single visitor might result in several visits.
Reports on behavior
The activities that your visitors perform are the subject of behavior reports, which provide a wealth of information that may help you develop better promotional packages and more successful targeted upselling.
Online shop conversion over time: Displays the proportion of visitors to an online store who have made a purchase over a specified time period.
Store Speed: Shows how your business compares to industry norms and other Shopify stores in terms of speed.
Product suggestion conversions over time: This graph illustrates how successfully your store converts product recommendations into sales over time.
The top popular online store searches: The search phrases your customers use to find goods or pages in your store are displayed here. There's also a report called Top online shop searches with no results, which lists the most popular searches that don't provide any results.

Behavior report
Knowing how customers interact with your store might help you make better business decisions. You may use your knowledge of product relationships to assist plan how to supply your inventory, arrange your product collections, and determine which goods might benefit from a marketing campaign, among other things.
Customer feedback
Customer reports include details about your clients, such as their average order count, total purchases, and predicted purchase value. When creating a marketing plan, they may also assist you in deciding how to segment your target.

Customer Feedback
You may create the following sorts of customer reports:
Customers over time: Displays the number of customers who have placed orders with your shop over a specified time period.
Sales of new vs. returning customers: Compares the value of orders placed by new vs. returning consumers.
Customers by location: View order and spend information for customers in a given geographic area.
Returning customers: View information about customers who have placed two or more orders in the past.
One-time customers: Displays information about customers who have only placed one order in their history.
At-risk clients: Displays information about returning consumers who haven't ordered in a while.
Loyal consumers: This section contains information on clients who buy from you on a regular basis.
Reports on inventory
Inventory reports provide a month-end picture of your inventory, allowing you to analyze daily sales and make better educated decisions about when and what to refill.

Inventory report
Owners of Shopify stores may produce the following inventory reports:
Month-end inventory snapshot: Displays the remaining stock of each product variant at the end of the month.
The average amount of inventory sold every day: Each product variant's average number of units sold each day is displayed.
Inventory sold as a percentage of total: Allows you to see the proportion of stock sold for individual product variations over a period of time that you choose.
ABC analysis by product: assigns a letter grade to each product variant depending on the percentage of revenue it generated to overall sales.
The pace at which a product is sold is called the sell-through rate. Displays the proportion of your total inventory that has been sold over a specified time period.
Inventory days remaining: Based on recent sales of your available items, this calculator predicts how long your current inventory will last.
Reports on marketing
Based on how visitors engage with your shop, marketing reports may show you which marketing channels are delivering the most traffic, sales, and total value. This may be quite useful in identifying which marketing channels to focus and the most effective sorts of marketing.

Marketing report
You may get reports on the following topics in Shopify's marketing reports:
Marketing-related sales: Shows how many sales can be linked back to certain marketing initiatives.
Marketing-related sessions: Displays how much web traffic is produced as a result of various marketing efforts.
Conversion by first interaction: Displays the number of orders received from first-time visitors, as well as the average value of those orders, to assist business managers in determining which referrals are most effective.
Conversion by last interaction: Displays the amount of orders from users who have not returned to your site since making a purchase.
Comparison of attribution models: Compares data from the first and final interactions to evaluate whether there is a major drop-off in consumers who have previously purchased.
Reports on ordering
Order reports include information on the volume of your orders, shipment timeframes, and returns. Order reports may show you which goods are the best-sellers and which are the most frequently returned.
You can create the following order reports:
Orders over time: View the number of orders delivered over a specified time period.
Timelines for fulfillment, shipping, and delivery: See how long it takes for orders to go through the fulfillment process from the moment they are placed to the time they are delivered.
Order fulfillment over time: View the total number of orders fulfilled, shipped, or delivered during a specified time period.
Profit and loss report
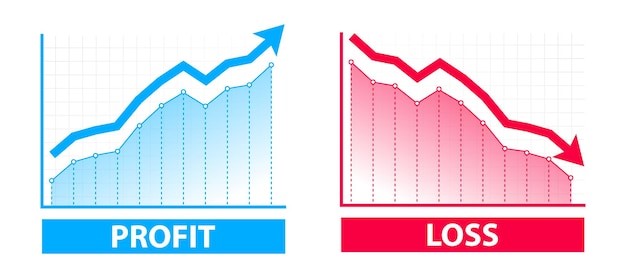
Profit reports provide useful information regarding your online store's expenses, margins, and profit. When it comes to accounting, being able to observe how money moves in and out of your organization is critical.

Profit report
Profit reports that Shopify retailers may create include:
Profit by product: Displays the overall profit by product for the time period specified.
Profit by SKU: Displays the overall profit of certain product variations over a specified time period.
Profit by Point of Sale Location: Displays gross profit by point-of-sale location, which is particularly useful for retailers who have many physical locations.
However, different stores shall have different requirements of report types. A large-scale and well-planned store shall need more types of reports than a small and newly-setup shop. If you have a small shop and look for a less complicated application which doesn't have to offer full options of reports of all aspects, we highly recommend Super Report – Data Export. It has the most fundamental reports such as sales reports, inventory reports, customer reports or shipment reports, etc. to help you see the big picture of your store performance.


1 comment
I was very much delighted to read your article. It was very interesting and informative. I would like to add some easy steps which are as follows:
1.Cyfe
2.Swell Analytics
3.Vantage Analytics
4.RevTap by Upstroke
5.Topdser Insights
6.SearchTap
7.SocialProof
These are some points which I wanted to include in your article. Readers, If you create your shopify website, you can visit an IT company like Alakmalak technologies. They have 17+ years of experience in this field.