The most successful business entrepreneurs understand the value of data. Metrics paint a clear picture of performance and give critical insights for progress. Analyzing important ecommerce indicators related to brand revenue, credibility, and customer base development results in greater revenue and wiser, data-driven decisions. The last article has given you a couple of metrics to track your Shopify store performance, however; it would be better if you thoroughly measure your store in every aspect.
1. Customer Retention Rate
Customer retention refers to how many consumers return to your website and purchase things on a regular basis. It refers to the number of customers who return. The higher the figure, the more profit you'll make and the better your brand's reputation will be. Consistent purchases from the same name can help you expand your customer base. It will assist you in moving from recognition to development and expansion as fast as possible.

Customer Retention Rate
Because 81% of purchasers prefer referrals from family and friends to those from businesses, focusing on increasing customer retention is a smart strategy.
To do so, follow these steps:
Ensure a positive customer experience
Set up loyalty programs
Customer feedback is something you should ask for and work on
Provide proactive assistance
Make customized suggestions
2. Net Promoter Score
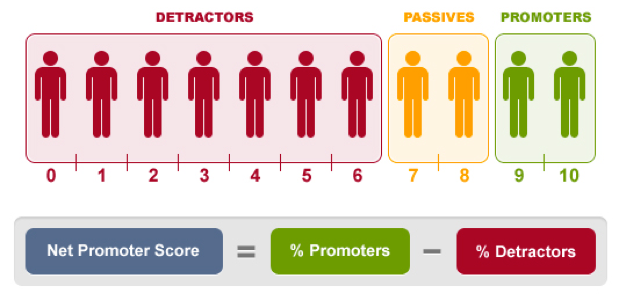
Customers fill out a survey form to assess their happiness and probability of recommending a company, and the Net Promoter Score (NPS) is a customer satisfaction and brand advocacy indicator.

Net promoter score
Making sure your consumers are happy may lead to not only repeat purchases but also brand supporters. Make sure to do the following to improve customer satisfaction:
Consistently assess customer satisfaction.
Inquire about customer feedback and act on it.
Ensure a pleasant user experience.
3. Total Sales
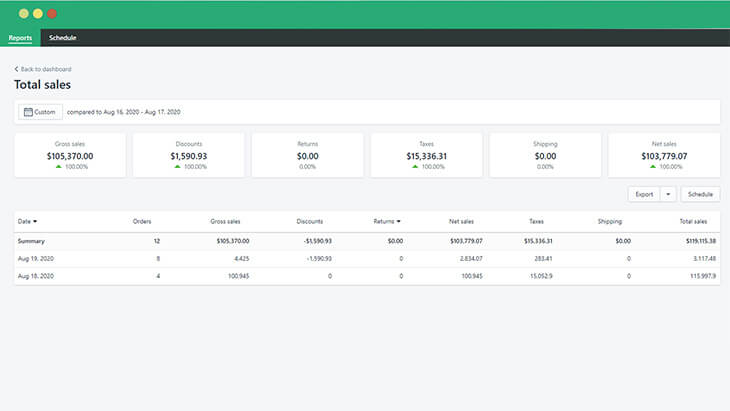
The total sales or revenue generated by your Shopify store is the amount of money you make by selling your items to customers over time.
Examining your overall sales might help you understand:
The purchasing habits of your customers
This is your busiest time of year.
This measure might help you spot patterns in your customers' purchasing habits. For example, if your online store's sales increase around a specific event or day of the week, it's a good idea to plan ahead. The formula for determining total sales is as follows: Total revenue/sales = quantity of things sold x product prices

Shopify Super Reports
Take some time to look at the patterns in your overall sales report as well. It might be because you ran an email campaign during this time period with an exclusive offer or made a social media post advertising a new product. This might be a wonderful place to start if you're looking for fresh campaign ideas or want to improve your current ones. The Shopify merchants can easily track their total sales by using Shopify reports applications such as Super Reports which shall give you a full overview of your store performance and every valuable detail.
4. Average Order Value
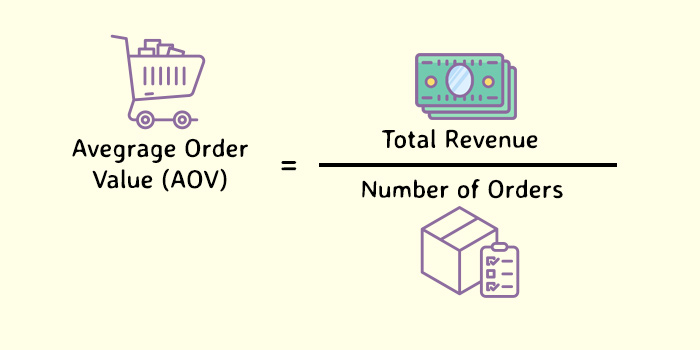
The amount a consumer spends on purchases from your website is known as the average order value (AOV). Consider that the AOV for the ecommerce business is around $116 if you're interested in how your store compares.

Average Order Value
This ecommerce metric may be used to:
Recognize consumer behavior
Create more effective marketing strategies
Improve the price structure
5. Revenue Per Traffic Source
This ecommerce measure shows how much money you make from different traffic sources, such as paid search, social media, and referrals. Knowing where to put your effort and money in terms of traffic is an important aspect of good marketing. Understanding your income by traffic source also indicates which channels are the most profitable, allowing you to double down.

Revenue Per Traffic Source
You'll know where to focus your marketing once you've identified your most successful traffic sources. You may track your revenue by traffic source using Google Analytics.
6. Cart Abandonment Rate
Another important measure to monitor is shopping cart abandonment. Customers abandoned 88.05% of their shopping carts in March 2020 alone, according to Statista.

Shopping cart abandonment can be caused by a number of factors, including:
A complicated checkout procedure is in place. A convoluted checkout procedure may turn off a prospective consumer, leading to cart abandonment. MESA's workflow templates, on the other hand, enable you to construct a straightforward and efficient checkout procedure.
7. Net Profit Margin
Your gross profit margin and net profit margin are identical. It is, nevertheless, a more comprehensive measure of profitability. The proportion of net profit generated by your online store is known as the net profit margin.

Net profit margin
In other words, after accounting for outgoing and incoming cash flow such as cost of products sold, affiliate profits, and annual operating costs such as website hosting and taxes, it's the amount of money remaining.
Here's how to figure out what your net profit margin should be: Net Profit Margin = (Total revenue – Total Cost) ÷ Total revenue
Now that you fully know which ecommerce metrics to monitor for your business, it's time to figure out what's working and what isn't with your store and marketing approach. Don't, however, limit yourself to measurements. Are you ready to use ecommerce automation to improve your customer experience, increase website conversions, and increase revenue?

